


Financial Model
WHAT WILL I GET WITH THREE WAY FINANCIAL MODEL?
All in One Place
Get a sophisticated but easy-to-use Cash Flow Proforma Template that is fully expandable. Our robust and powerful Three Statement Financial Model will be your roadmap for many different business models. If you have financial experience, you can expand and tailor all sheets as desired.
Performance KPIs
Lead-to-client conversion rate. Lead-to-Client Conversion Rate is an essential metric for the businesses that attract new clients with the Internet, social media, and other similar channels. Leads do not turn into customers automatically. Company's sale team need to convert these leads into actual customers. The Lead-to-Conversion business metric is a good measure of the sales team's performance. Moreover, it indicates the quality of your product. If you have a low conversion rate, it may sign that your product is not attractive to the customers.
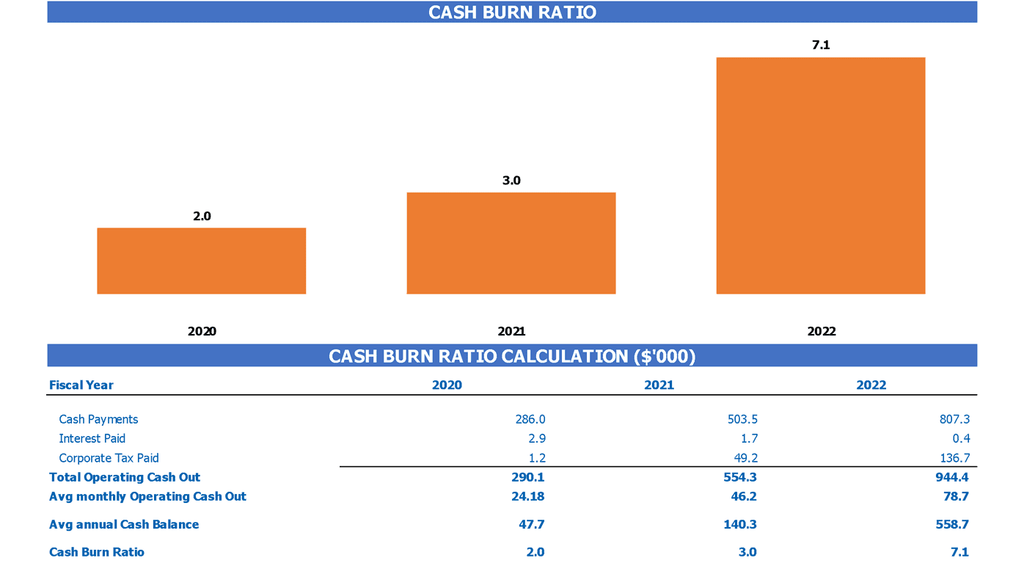
Burn and Runway
This 3 Way Forecast Model automatically calculates the cash burn rate based on the inputs from other spreadsheets, in particular, from the cashflow forecast.
Valuation
This Excel Financial Model Template contains a valuation analysis template that will allow users to perform a Discounted Cash Flow valuation (DCF). It will also help users analyze such financial metrics as residual value, replacement costs, market comparable, recent transaction comparable, etc.

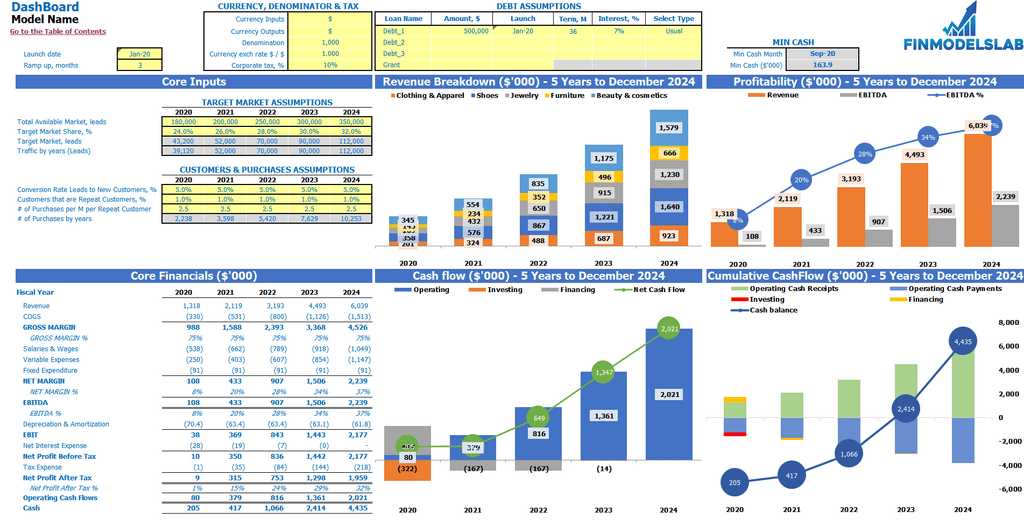
Dashboard
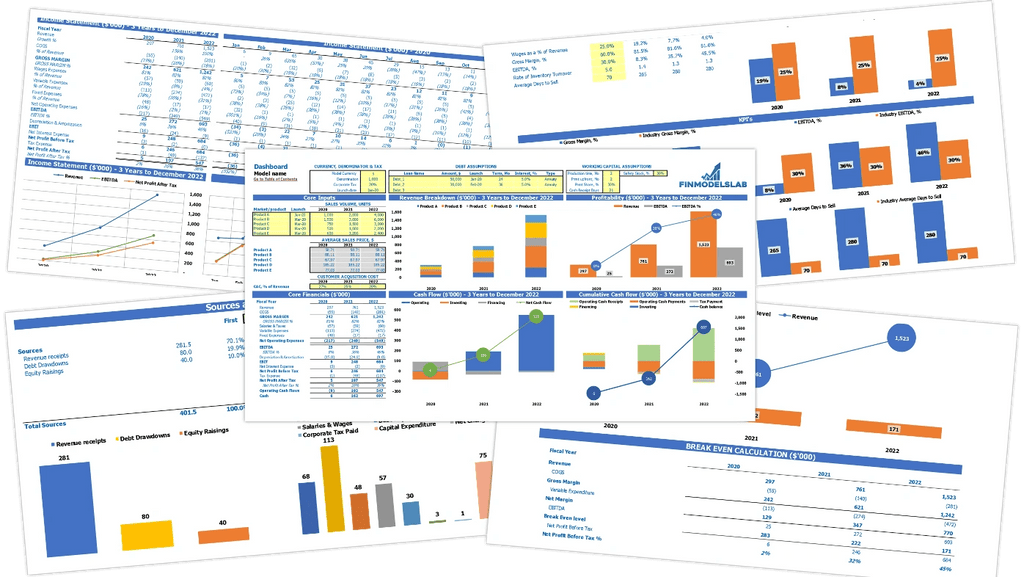
The All-in-one dashboard in this Excel Pro Forma contains all core financial inputs and core start-up metrics critical for the companies' financial analysis. It reflects the financial data from a Balance Sheet, an proforma income statement, and a pro forma cash flow projection. Moreover, users can obtain financial information in the form of graphs or charts.
Loan opt-in
The loan amortization schedule template in this Cash Flow Proforma Template reflects the schedule of repayment of the loan. It shows detailed information about the company's periodic payments or installments that comprise of principal amount and an interest component. These elements are shown in the loan amortization schedule template for the period till the end of the loan term or up to which the full amount of the loan is paid off.

Top Expenses
It is very important for a start-up and existing company to monitor, plan, and manage its costs and expenses to maintain a good profitability level. For this purpose, it is necessary to analyze the highest costs and always work on their optimization. In our Financial Projection Excel we have created a Top expense report helps users with this task. It summarizes the four biggest expense categories and the rest of the expenses as the 'other', so the users can easily monitor these expenses and track the tendencies related to their increase or decrease from year to year.

CAPEX
Capital expenditures, or CapEx, calculations reflect the company's spendings to buy various assets that will bring long-term value to the company. CapEx is typically related to buildings, property, plant, and equipment (PPEs). Our Financial Model Excel Spreadsheet has a pre-built tab for CapEX calculations that will help users determine the company's growth and expansion plans that require significant spendings on equipment and other assets. It is important for business owners and financial specialists to understand the relationship between the company's CapEx, deprecation, and financial statement.

Sources and Uses
The sources and uses statement in this Financial Projection Template Excel describes all of the company's funding sources and the ways it spends these funds.

Cash Flow KPIs
Operating cash flow. Operating cash flow calculation shows how much cash the company generates from the business operations. This calculation does not include secondary sources of revenue, like interest or investments.

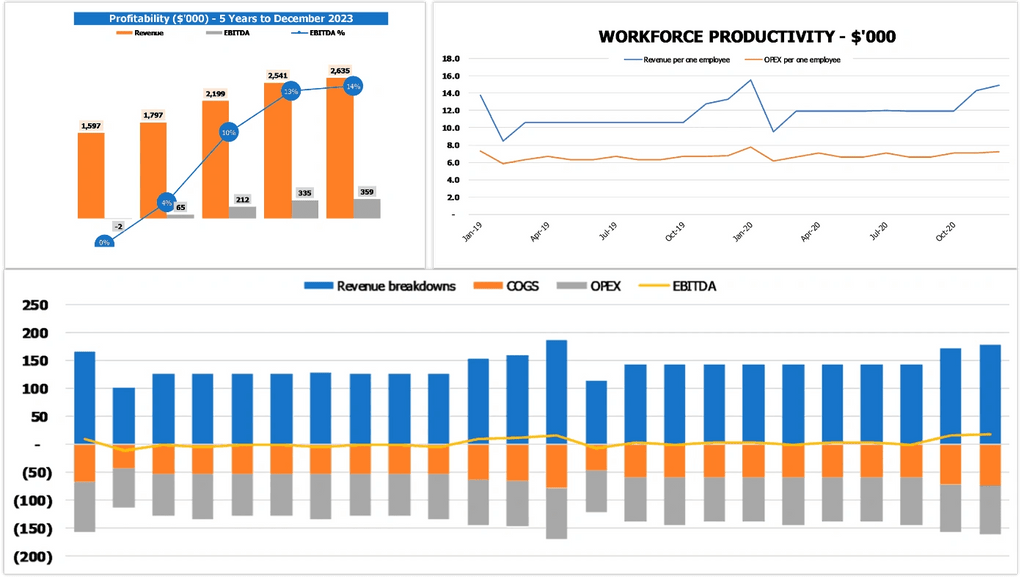
Profitability KPIs
Return on investment (ROI). ROI is an essential measure of profitability. Return on investment (ROI) shows a ratio between cash inflows and cash outflows that follow from the investments. The ROI ratio can be calculated as net investment gains divided by total investment costs.

Costs
Start-up costs are an essential part of any Three Statement Financial Model Template. They begin to accrue before actual operations start, so it is crucial to monitor them early to avoid overspendings and underfunding. Our Financial Projection Model Excel has the proforma for start-up costs that show both funding and expenses. You can use this proforma to monitor your expenses and create cost budgets.

Liquidity KPIs
Current Ratio. The current ratio is a liquidity ratio that helps users measure a company's ability to meet short-term obligations that should be paid within a year. This financial metric tells investors how a company can maximize the current assets on its balance sheet to cover its current debts.

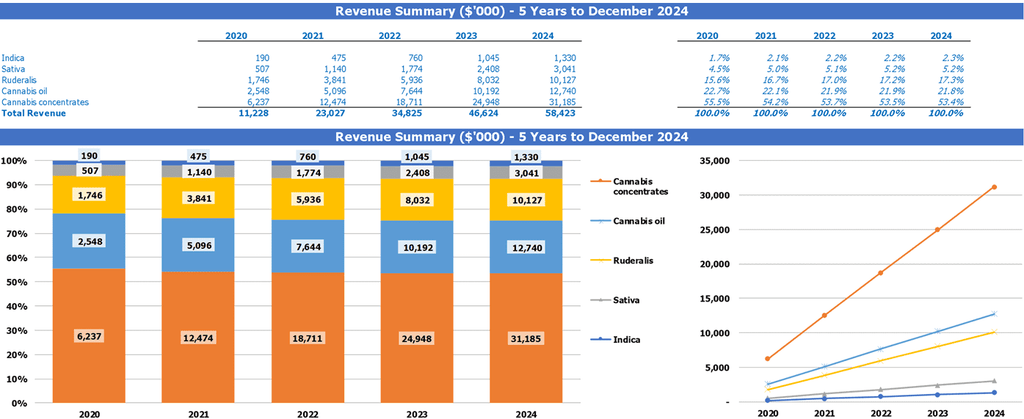
Top Revenue
The Top revenue tab in the Five Year Financial Projection Template shows off the financial information regarding each of your offerings. In particular, with the help of this Three Way Financial Model, you can obtain an annual breakdown of your revenue streams, including the revenue depth and revenue bridge.
Cap Table
A capitalization table or the cap table is an essential financial tool for start-up companies. A cap table in our Finance Projection has four rounds of raising funding. This approach will help users anticipate the company's ownership stakes by its shareholders, which will lead to dilution of existing shares. A cap table considers equity shares, preferred shares, share options, employee stock options, convertible bonds, and others.

Benchmarks
A benchmark study calculates the company's key performance indicators, either business or financial, and finds an industry-wide average as a comparison. The industry average metrics are then used to determine the relative value for benchmarking analysis. Financial benchmarks are essential for the financial planning of the companies, especially for start-ups. These studies help companies determine the 'best practice' companies within the industry and compare their own financial results with these best practices. It is a useful financial and strategic management tool.
