


Financial Dashboard
The Financial Dashboard Excel spreadsheet will produce 3 KPI dashboards that can be seen month by month with growth comparisons and trends.


Financial Dashboard Excel metrics


Financial dashboard excel will come in handy when you need to
Analyze actual revenue and compare it with budget
See the dynamic of working capital during the year
Compare your assets and liabilities
Quick decision-making KPI tracking Month to Month and Year to Date
Track changes in the margin and net profit
Determine the return of equity (ROE)
Analyze the liquidity of your business
Financial Dashboard available visualisations
Financial dashboard liquidity
Here is one of the three dashboards called the liquidity kpi dashboard. It highlights the account receivables and payables turnover in days for the chosen month. Liquidity KPI dashboard mainly focused on the working capital KPIs like account receivables turnover in days and account payables turnover in days
Financial efficiency dashboard is focused on the cash conversion cycle and the revenue
At the financial efficiency side of the financial dashboard template, you may find the Cash Conversion Cycle calculation, which shows how efficiently a company is managing its working capital. The Cash Conversion Cycle takes into account the time needed to convert cash into inventory and accounts payable (AP), then through sales and accounts receivable (AR) back into cash. This is the one of core finance kpis at the dashboard.
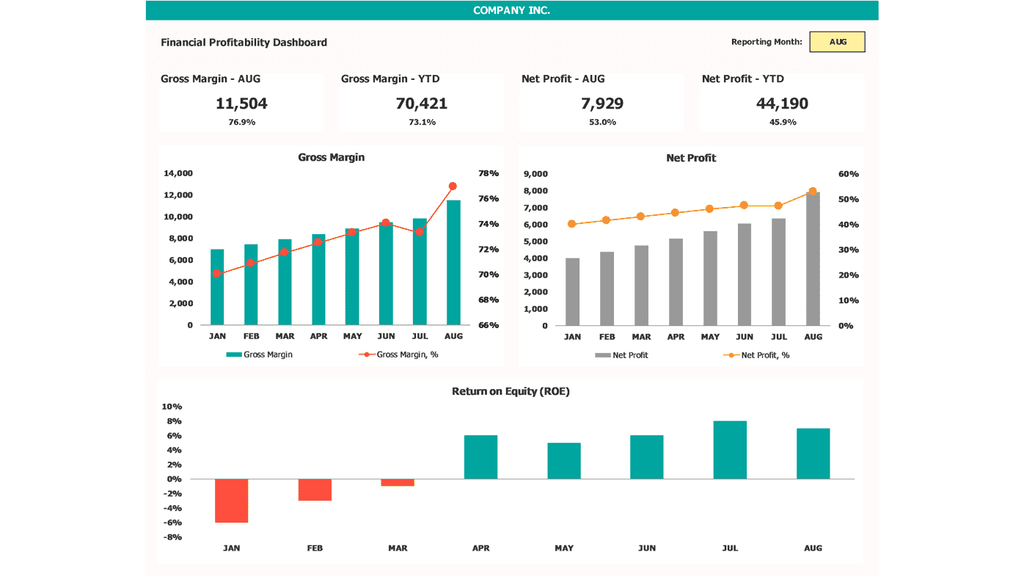
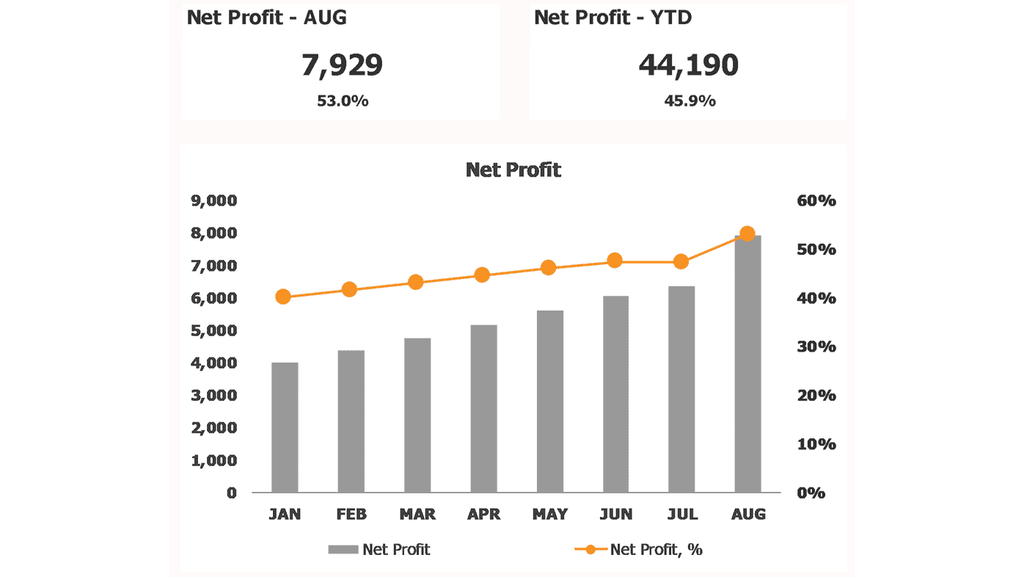
Key profitability KPIs in the financial dashboard template
Profitability ratios are used to assess a business's ability to generate earnings. Most of the profitability ratios are calcualted in relative to revenue, operating costs, assets, and equity. In this key performance indicator template excel, you will find gross margin, net profit, and Return on Equity ratios on a single page with the year to date comparison.
Revenue over time
This chart shows you the revenu iver time Financial dashboard efficiency revenue chart
Budget vs Actuals variance analysis
Here you may track the difference between actuals and budget ratios Actual versus budget variance analysis
Current Ratio and Cash Conversion Cycle
It shows you the current ratio over time Current ratio chart This chart shows the cash conversion cycle over time Cash Conversion Cycle Chart
Gross Margin Ratio and Net profit and Return On Equity
Gross margin is a net sales minus its cost of goods sold (COGS). The gross margin ratio is a percentage resulting from dividing the amount of a company's gross margin by net sales. With the financial dashboard template, businesses may continuously track the gross margin ratio to be assured it is sufficient to cover its selling, general and administrative expenses, interest expense, and to earn a profit. The net profit is equal to gross profit minus operating expenses and income tax. The net profit margin shows how much net income or profit is generated as a percentage of revenue. One the the core profitability ratios is the net profit margin. The net profit margin illustrates how much of each dollar in revenue turns into profit. Return on equity (ROE) measures how effectively management is using a company’s assets to make profits. You may track ROE with the finance kpis dashboard over time
KPI excel template inputs
KPI excel template inputs This tab was designed to allow you to enter all the required financial inputs to calculate the core financial KPIs. Fill the yellow lines with data to run automatical KPIs calculation